Acknowledgement: I thank Andrew Biggs for his assistance in replicating his numbers.
In a new paper from the American Enterprise Institute, Andrew Biggs and Sylvester Schieber argue that workers retirements are more secure financially than some suggest. In part, they point to the ratio of household assets to wage earnings for those with heads aged 45-54. While their criticisms may have some validity, there are some significant omissions that cut the other way. On balance, it is likely that most households will rely more heavily on Social Security to support their retirements than in prior years.
According to the Survey of Consumer Finances, on average household wealth for the 45-54 age group fell from 5.8 years of wages in 2007 to 4.7 in 2013. Household wealth here— consistent with Biggs and Schieber—includes the value of a home and any other real estate, plus financial wealth. Mortgages and other debt are subtracted to get this number, as seen in Figure 1.
Figure 1: Biggs and Schieber’s mean assets relative to household wage income: all 45-54 year old householders
Source: Survey of Consumer Finances and author’s calculations
At 5 percent interest, this wealth could replace only 23.4 percent of current wage income compared to 28.8 percent in 2007.1
Thursday, April 9, 2015
Trends in the Labor Force 1999-2014: Seniors Increase Participation, Younger Workers Withdraw
In early 2000, the civilian labor force participation rate peaked at a post-war high of 67.3 percent of the population aged 16 and over. Despite flattening out in the latter part of the decade at about 66 percent, participation rates never recovered and have steadily fallen since the onset of the Great Recession. At 62.8 percent as of November 2014, labor force participation is now at its lowest level since 1978.
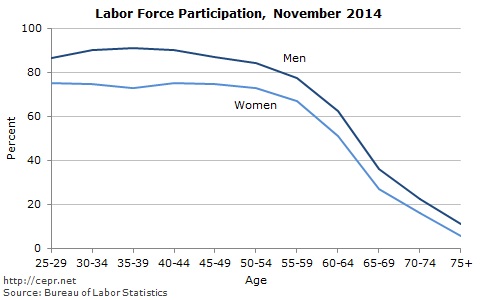
Some of this fall is clearly demographic. Workers are much less likely to have or search for a job once near or past retirement age, as seen in Figure 1.
Figure 1:
Thus, the aging of the baby boom generation has reduced the size of the labor force. On the other hand, retirement-age workers are participating at a much higher rate than before. In small part, this is because baby-boomers have reduced the average age of those 65 and over. However, labor force participation in the older population has been rising for some time, as seen in Figure 2.
Figure 2:
Some of this fall is clearly demographic. Workers are much less likely to have or search for a job once near or past retirement age, as seen in Figure 1.
Figure 1:
Thus, the aging of the baby boom generation has reduced the size of the labor force. On the other hand, retirement-age workers are participating at a much higher rate than before. In small part, this is because baby-boomers have reduced the average age of those 65 and over. However, labor force participation in the older population has been rising for some time, as seen in Figure 2.
Figure 2:
Tuesday, March 3, 2015
“Mumbo-Jumbo” Mumbo-Jumbo
Today, Cato’s Alan Reynolds took a few bizarre shots from the pages of the Wall Street Journal. In particular, Reynolds it calls “far-fetched” that incomes of the middle class have stagnated for decades.
First, he asserts “The average income for the bottom 90% is not a decent proxy for the median nor even a decent measure of household income." This is clearly indefensible as a check of the numbers at Reynolds’ source demonstrates. Here, we see the average of the bottom 90 percent and the median compared for both before-tax and after-tax household income.
(Source)
Over Reynolds’ chosen 1984-2007 period, median before-tax income fell 0.05 percent per year relative to the bottom 90 percent and median after-tax income rose less than 0.01 percent per year relative to the bottom 90 percent. Obviously, such differences are in no way meaningful.
Next, Reynolds argues that median after-tax (and transfer) measures better describe the evolution of middle-class incomes than does pre-tax and transfer “market income.” However, the comparatively higher rate of growth in after-tax income simply reflects the government attempting to compensate households for the broad stagnation of income. If the median household is better off in 2007 than 23 years prior it is because we have recognized that wages have fallen and households have had to work much more to maintain a modest 0.5 percent annual increase in pre-tax income. We have increased transfers and cut taxes in order to help those households to share in the increased productivity of the economy.
It is also worth noting that much of the increased transfers which make up the wedge between market and pre-tax incomes have come as a result of a broken health-care system. The government now pays health providers considerably more and yet life expectancy for those in the bottom half of the income distribution has grown so slowly that such workers may enjoy shorter– not longer– retirements. It is not so obvious that such increases in payments contribute to growth in household income.
It is no surprise then that real per-person consumption has grown faster than median pre-tax household income. Not only does this conflate the median with the overall average— it ignores that household savings rates have declined considerably over the decades in question. In 1989, the median net wealth of households headed by someone aged 45-54 was \$177,300 compared to only \$105,400 in 2013. Even that does not consider the simultaneous decline in defined-benefit pensions held by such households.
The middle class may still appear middle class because households have dedicated more time to work, received increased assistance from the government, and accumulated considerably less wealth than the previous generations; such measures merely hide the obvious stagnation.
First, he asserts “The average income for the bottom 90% is not a decent proxy for the median nor even a decent measure of household income." This is clearly indefensible as a check of the numbers at Reynolds’ source demonstrates. Here, we see the average of the bottom 90 percent and the median compared for both before-tax and after-tax household income.
(Source)
Over Reynolds’ chosen 1984-2007 period, median before-tax income fell 0.05 percent per year relative to the bottom 90 percent and median after-tax income rose less than 0.01 percent per year relative to the bottom 90 percent. Obviously, such differences are in no way meaningful.
Next, Reynolds argues that median after-tax (and transfer) measures better describe the evolution of middle-class incomes than does pre-tax and transfer “market income.” However, the comparatively higher rate of growth in after-tax income simply reflects the government attempting to compensate households for the broad stagnation of income. If the median household is better off in 2007 than 23 years prior it is because we have recognized that wages have fallen and households have had to work much more to maintain a modest 0.5 percent annual increase in pre-tax income. We have increased transfers and cut taxes in order to help those households to share in the increased productivity of the economy.
It is also worth noting that much of the increased transfers which make up the wedge between market and pre-tax incomes have come as a result of a broken health-care system. The government now pays health providers considerably more and yet life expectancy for those in the bottom half of the income distribution has grown so slowly that such workers may enjoy shorter– not longer– retirements. It is not so obvious that such increases in payments contribute to growth in household income.
It is no surprise then that real per-person consumption has grown faster than median pre-tax household income. Not only does this conflate the median with the overall average— it ignores that household savings rates have declined considerably over the decades in question. In 1989, the median net wealth of households headed by someone aged 45-54 was \$177,300 compared to only \$105,400 in 2013. Even that does not consider the simultaneous decline in defined-benefit pensions held by such households.
The middle class may still appear middle class because households have dedicated more time to work, received increased assistance from the government, and accumulated considerably less wealth than the previous generations; such measures merely hide the obvious stagnation.
Wednesday, December 3, 2014
Thomas Piketty and the evolution of capital
Having finally read through Capital in the 21st Century (and spent considerable time with the supplied data) I find many critiques of Thomas Piketty very odd. Part of this is that Piketty (to my mind, anyway) tries very hard to take care with his words. Thus, I get annoyed when I see Branko Milanovic write
Piketty defines “capital” or “wealth” as the market value of productive physical capital and net financial assets owned by households and government. Piketty’s capital includes residential real estate, but not consumer durables. It includes corporate-owned equipment through direct stock holdings of households and indirect holdings through pensions and other savings vehicles. Capital also includes holdings of foreign assets net of liabilities. Piketty divides the total value by national income (net of capital depreciation) and expresses the result, $\beta$, in terms of years.
Now define (net) savings as net investment and net acquisition of foreign financial assets so as to equal the change in real wealth, apart from miscellaneous volume adjustments and inflation-adjusted capital gains. If we presently assume these are zero, then the capital-income ratio must evolve as $$ \beta_t=\frac{\beta_{t-1}+s_{t-1}}{1+g_t} $$ where $s_t$ is net savings as a share of net income in period $t$ and $g_t$ is the real (inflation-adjusted) growth rate of net income from period $t-1$ to $t$. Note that regardless of $\beta_{t-1}$ or $g_t$, if $s_{t-1} < g_t\beta_{t-1}$, then $$ \beta_t<\frac{\beta_{t-1}+g_t\beta_{t-1}}{1+g_t}=\beta_{t-1} $$ Thus, Piketty’s “stock of capital is increasing faster than net income” if and only if there is sufficient net savings irrespective of the rate of return on capital.
What then is the significance of $r>g$? Stay tuned...
Just as a reminder: as we all know by now, $r>g$ implies that the stock of capital is increasing faster than net income.We know this? Milanovic of course does not. Indeed, his post outlines a case where it may not be true. What irks me is that Milanovic seems to believe it to be generally understood. Frankly, I am not clear if Milanovic is critiquing Piketty or the public. With that in mind, let us begin to review the basic analytical framework presented in Capital.
Piketty defines “capital” or “wealth” as the market value of productive physical capital and net financial assets owned by households and government. Piketty’s capital includes residential real estate, but not consumer durables. It includes corporate-owned equipment through direct stock holdings of households and indirect holdings through pensions and other savings vehicles. Capital also includes holdings of foreign assets net of liabilities. Piketty divides the total value by national income (net of capital depreciation) and expresses the result, $\beta$, in terms of years.
Now define (net) savings as net investment and net acquisition of foreign financial assets so as to equal the change in real wealth, apart from miscellaneous volume adjustments and inflation-adjusted capital gains. If we presently assume these are zero, then the capital-income ratio must evolve as $$ \beta_t=\frac{\beta_{t-1}+s_{t-1}}{1+g_t} $$ where $s_t$ is net savings as a share of net income in period $t$ and $g_t$ is the real (inflation-adjusted) growth rate of net income from period $t-1$ to $t$. Note that regardless of $\beta_{t-1}$ or $g_t$, if $s_{t-1} < g_t\beta_{t-1}$, then $$ \beta_t<\frac{\beta_{t-1}+g_t\beta_{t-1}}{1+g_t}=\beta_{t-1} $$ Thus, Piketty’s “stock of capital is increasing faster than net income” if and only if there is sufficient net savings irrespective of the rate of return on capital.
What then is the significance of $r>g$? Stay tuned...
Tuesday, December 2, 2014
Mitchell finally notices the obvious
Cato’s Daniel J. Mitchell finally takes note of years of flat government spending. Months ago, I suggested this ought to make him “love President Obama” but he is still keeping any love to himself. Instead, Mitchell merely speculates this is all ”very depressing“ for the President.
On the other hand, he damns Obama with faint praise.
And even though we haven’t had impressive growth during the Obama years, there have been modest increases in both nominal GDP as well as inflation-adjusted (real) GDP.Yes. There has been growth. Whee. Give it another six years and he may even consider the connection between the government’s withdrawal of demand and the piss-poor growth of the economy.
Wednesday, September 10, 2014
Waste is waste is waste
The fact that we are able to meet the nutritional needs of a great many more people does not mean we have no need for sewage systems and water treatment plants to deal with the slough of disease-spreading shit running down our streets.
Likewise, increased carbon dioxide concentration in the atmosphere is no cause for celebration.
That is all.
Likewise, increased carbon dioxide concentration in the atmosphere is no cause for celebration.
That is all.
On Congressional snack accounting
K. William Watson wrote an amusing little piece yesterday over at Cato. Riffing off a POLITICO article about Congressional staff bartering gifts of snack food, Watson highlighted the natural impetus to trade. In his own words he writes “[i]n order to be insufferably pedantic.”
On the contrary, Watson is insufficiently so. He writes
A trade deficit results from drawing down on currency or other capital stores to finance an excess of imports over exports. To a first approximation, then a snack trade deficit involves paying more cash for snacks obtained than the cash received for snacks given up. But the Congressional snack trade is regulated so no cash may change hands and everyone winds up with exactly the cash they started with. There can be no snack trade deficit so long as staffers merely barter snacks.
But snacks are not the only medium circulating in the Congressional snack trade. According to the POLITICO article, snacks have been exchanged for use of a cell phone charger. This is probably no big deal. Use of snacks for rewarding unpaid interns is probably a but more sketchy, but pales in comparison to the fact that there are unpaid interns. Ultimately, the critical question is what else might be exchanged for snacks?
On the contrary, Watson is insufficiently so. He writes
I think it’s worth pointing out how crazy it would be to restrict this trade. Should offices worry that they’re running a snack trade deficit? Are some snacks being unfairly traded at too low a price? Are other offices inadequately inspecting their exports for safety?Obviously, the trade is highly regulated. Only certain gifts may be exchanged, and production of these snacks presumably fall under common regulatory schemes before entering into the staff barter system. Ultimately, though, I would like to focus on the question of the “snack trade deficit.” Offices should worry about the existence of such deficits– not because trade deficits do not matter; rather it is unclear what a legal snack-trade deficit might look like.
A trade deficit results from drawing down on currency or other capital stores to finance an excess of imports over exports. To a first approximation, then a snack trade deficit involves paying more cash for snacks obtained than the cash received for snacks given up. But the Congressional snack trade is regulated so no cash may change hands and everyone winds up with exactly the cash they started with. There can be no snack trade deficit so long as staffers merely barter snacks.
But snacks are not the only medium circulating in the Congressional snack trade. According to the POLITICO article, snacks have been exchanged for use of a cell phone charger. This is probably no big deal. Use of snacks for rewarding unpaid interns is probably a but more sketchy, but pales in comparison to the fact that there are unpaid interns. Ultimately, the critical question is what else might be exchanged for snacks?
Alabama Republican Rep. Robert Aderholt’s chief of staff, Brian Rell, said in an email that he doesn’t see a lot of trading going on; “it is more like a tailgate where food is readily available.”To the extent this is true, great. Share and share alike. Perhaps there are offices which are snack-rich and others snack-poor and so there may be net transfers of snacks from rich to poor showing up in the snack accounts even if there are no snack trade deficits. But to the extent that there are any expectations for non-snack compensation offices should very much worry about large snack account imbalances.
Subscribe to:
Posts (Atom)